The recent hot spell in New Zealand and Australia put a lot of water supply systems under pressure. Knowing what the demand will be for the current day and for the next 7 days allows for proactive management of supplies, water restrictions and consents. Learn how to predict summer demand.
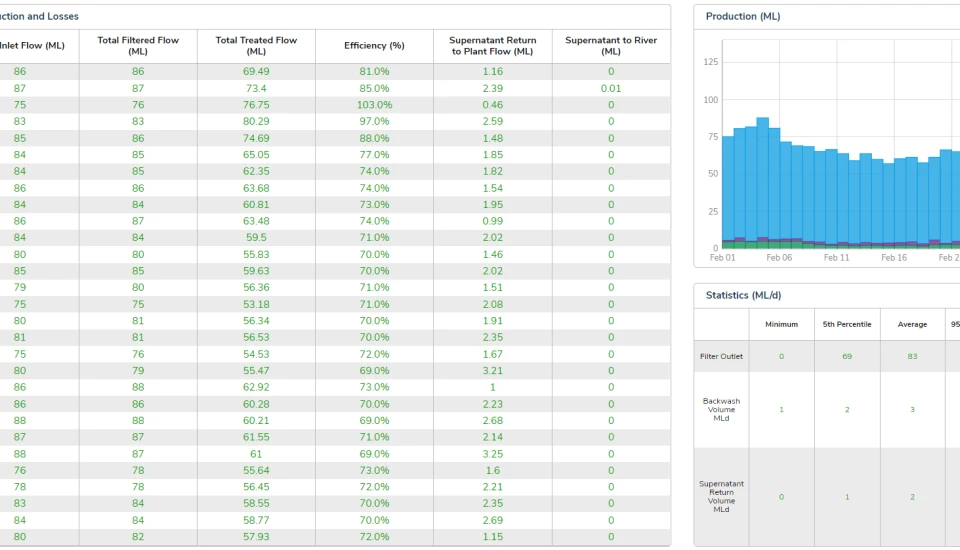
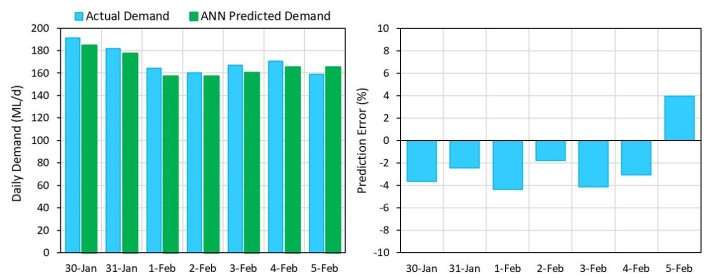
Here’s a demand prediction for the Wellington region in New Zealand. The prediction was made on the 30th January 2019 for the 7-day period of 30th January to the 5th February. Actual production data up to the 4th of February shows the prediction accuracy. The daily prediction error, even out to 6 days, was less than 5%.
Having an accurate demand model allows water suppliers to predict when demand will get close to, or even exceed production capacity. This tells them in advance when they will need to put on water restrictions or when they can take them off allowing for a stream-lined communication strategy with the public. It also tells them if they need to extract more source water which may require an emergency abstraction consent and approvals from regulatory bodies. So, how do you get an accurate demand prediction? There are three steps.
Step 1 - Data Preparation
The Wellington prediction was based on a 5-year data set of daily production and weather data. The weather data used was
maximum hourly average windspeed (Wellington is very windy!), total daily rainfall, maximum daily temperature and minimum daily temperature. The data was normalised for calendar days and an allowance was made for population growth. The larger the data set the better the result. Smaller data sets can be used but reduce the accuracy of the prediction.
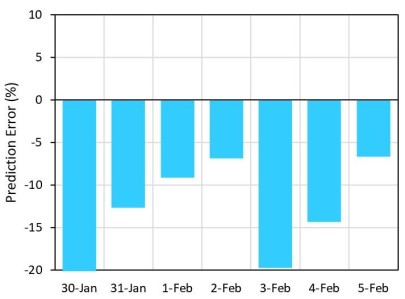
If the prediction is only based on the historical dataset the errors can be significant. The prediction errors for the Wellington dataset against actual production are as high as 20%.
Step 2 - Artificial Neural Net (ANN) model development
The ANN model uses the weather conditions for the previous 4 days and next seven days to calculate a daily correction factor for the base dataset. The prediction for the current day has a 25% weighting on the forecast conditions. The prediction for day 2 has a weighting of 50% on the forecast and so on. The ANN model used was a non-linear autoregressive neural network with external input (NARX).
Step 3 - Implementation
The weather in Wellington is very changeable, so during peak periods the model predictions are generated three times a week. For the whole summer of 2018 the daily prediction had a deviation <10% for 100% of the time and a deviation <5% for 91% of the time.
Conclusion
Predicting the demand over the next 7 days with an accuracy of less than 5% most of the time and less than 10% all of the time allows water suppliers to more effectively manage their sources, treatment plants and distribution networks. This means alternative sources and additional treatment capacity can be brought online and reservoir levels topped up. Being prepared means that there is less likelihood of needing to impose restrictions, exceed consent requirements or otherwise compromise in supplying water to the consumer.