Most treatment plants have the instrumentation necessary to be able to create great analytics in real-time, turning data into actionable process insights. Yet despite all the talk of digital transformation in our industry there are precious few plants where this actually happens. So here are 10 analytics that you could implement at your plants to kick start your own digital transformation.
The analytics presented here are intended to be calculated either in a plant PLC, for display in the plant control room, or in operational performance monitoring software for system wide optimisation. Whilst some of the analytics require a lot of maths, it’s all fairly basic stuff. In a previous post we’ve shown how artificial neural networks can be used to predict demand. In future posts we will focus more on machine learning and predictive analytics.
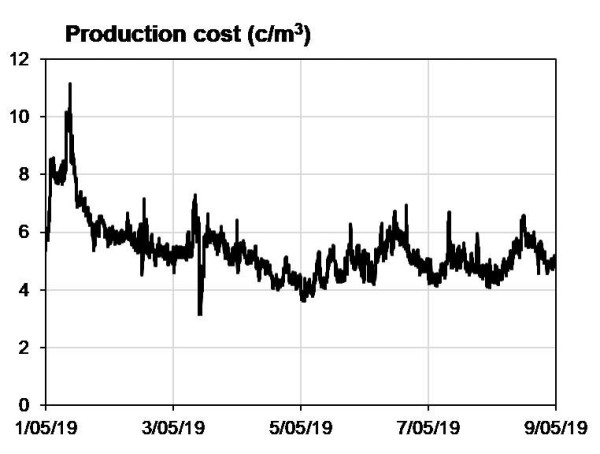
1 - Production Cost
Units: cents/m3
Let’s start with real-time production cost. This can be a powerful water supply management tool. If you have multiple plants, you can prioritise the plant producing the cheapest water. It’s also a good diagnostic tool for operators and can provide insights into the financial consequences of treatment adjustments. Treated water quality always comes first but eliminating overdosing can realise huge opex savings.
Production cost can be calculated by summing the component opex costs. The major opex component is chemical dosing. If chemical dose rates are metered, and chemical pricing is known, you can work out real-time treatment costs. Even if chemicals are not directly metered it’s possible to approximate from dose rates from pump speed or dry feeder speed for example.
Next, we have power, this needs to be metered and you need to know your power supply costs including any peaking factors.
Then we have sludge disposal. To work out a real-time cost for this you need to calculate the solids load based on raw water quality and coagulant dose applied. Then assuming your solid waste goes to landfill apply a price factor against kg of dried solids produced.
Finally, you can include labour. The simple way to do this is pro-rata plant labour costs. Or you can get more sophisticated by basing it on operator attendance. Combine all your calculations to give a total cost per m3 of water produced.
This can be taken one step further by normalising for raw water quality allowing a more accurate comparison of treatment plants. It can be taken two steps further by comparing against predicted costs to treat, a subject we’ll cover in future posts.
2 - Carbon footprint
Units: kg CO2/m3
This is calculated in a similar way to production costs but rather than applying dollar values for chemicals, power and landfill you apply a carbon balance value. This can be offset by environmental initiatives on the plant e.g. hydro-generation of power.
This is calculated in a similar way to production costs but rather than applying dollar values for chemicals, power and landfill you apply a carbon balance value. This can be offset by environmental initiatives on the plant e.g. hydro-generation of power.
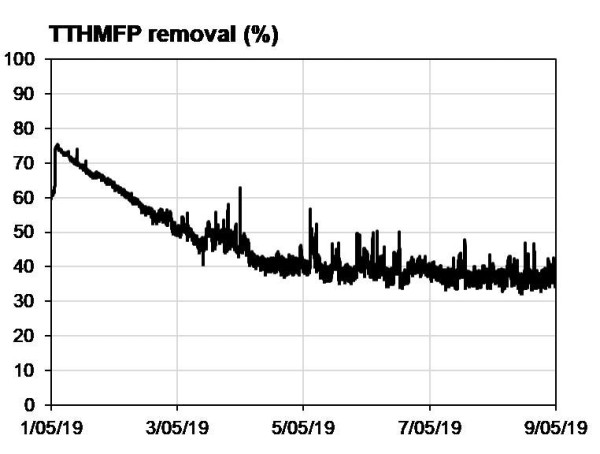
3 - THM/HAA formation potential
Units: THMFP (μg/L or sum ratio of MAVs), HAAFP (μg/L or sum ratio of MAVs)
A basic site-specific version of DBP analytics (can be determined using simple UVT measurement of raw water and some laboratory testing. More sophisticated universal versions can be developed using UV-Vis spectroscopy. Once relationships are developed, they can be applied on the plant in real-time on both source water and filtered water prior to chlorination. These parameters can be used for source water selection, treatment optimisation and real-time process control.
A basic site-specific version of DBP analytics (can be determined using simple UVT measurement of raw water and some laboratory testing. More sophisticated universal versions can be developed using UV-Vis spectroscopy. Once relationships are developed, they can be applied on the plant in real-time on both source water and filtered water prior to chlorination. These parameters can be used for source water selection, treatment optimisation and real-time process control.
4 - Hydraulic and solids loading rate
m3/m2/h and kg/m2/h
This one sounds obvious but converting flowrates to hydraulic loading rates makes it easier to define and understand performance limits of the treatment plant. By using inlet water quality data and the coagulant dose, a solids loading rate can be calculated. This can be used to control clarifier de-sludging, it’s particularly valuable for membrane plants and it’s a great metric for doing correlation analysis.
This one sounds obvious but converting flowrates to hydraulic loading rates makes it easier to define and understand performance limits of the treatment plant. By using inlet water quality data and the coagulant dose, a solids loading rate can be calculated. This can be used to control clarifier de-sludging, it’s particularly valuable for membrane plants and it’s a great metric for doing correlation analysis.
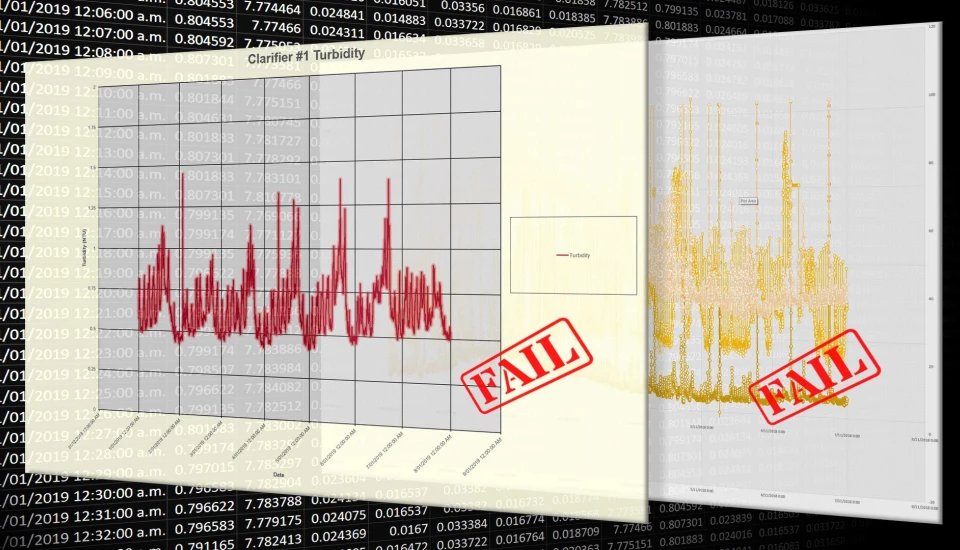
5 - Turbidity and/or organics removal
Units: %
Another seemingly obvious one is percentage removals. It’s amazing that this isn’t used more frequently because it’s particularly valuable for tracking organics removal. For Example if you have calculated THMFP you should track the removal of this in real-time for optimisation of chemical dosing.
Another seemingly obvious one is percentage removals. It’s amazing that this isn’t used more frequently because it’s particularly valuable for tracking organics removal. For Example if you have calculated THMFP you should track the removal of this in real-time for optimisation of chemical dosing.
6 - Volume calculation
Units: m3
Sites often have water storage dams or ponds which have non-linear volume / height relationships with no direct conversion between the two. This can waste time as available volumes for usage or disposal are calculated by hand or in spreadsheets against SCADA level indicators. Calculating the real-time volume by applying a non-linear equation saves time and gives greater operational transparency.
Sites often have water storage dams or ponds which have non-linear volume / height relationships with no direct conversion between the two. This can waste time as available volumes for usage or disposal are calculated by hand or in spreadsheets against SCADA level indicators. Calculating the real-time volume by applying a non-linear equation saves time and gives greater operational transparency.
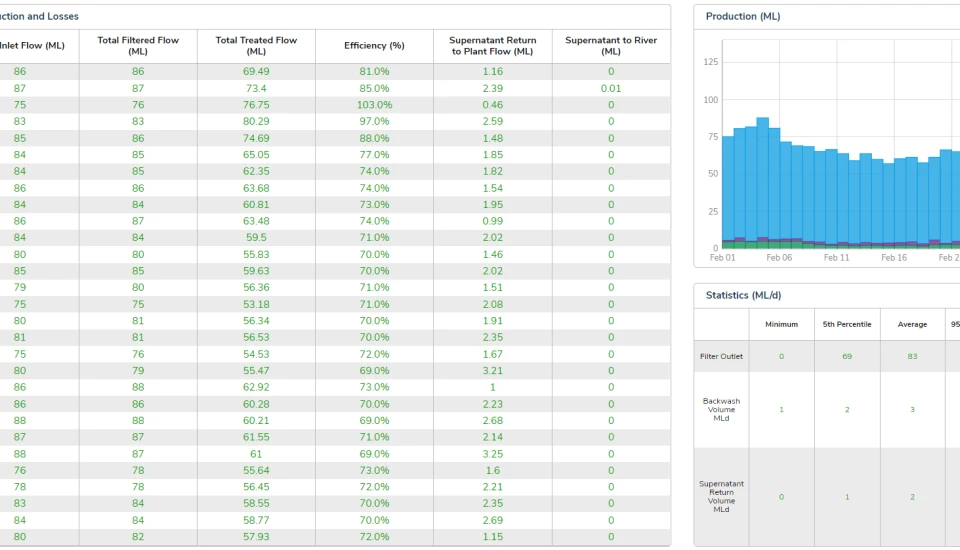
7 - Production efficiency
Units: %
Plant production efficiency can be calculated from existing plant flow meters and tank volumes. A rolling average over the previous 24 hours is an effective way of giving a “real-time” value which considers the impact of batch processes such as clarifier de-sludge and filter backwashing. It’s a good metric for identifying process issues and for driving improvements in plant efficiency.
Plant production efficiency can be calculated from existing plant flow meters and tank volumes. A rolling average over the previous 24 hours is an effective way of giving a “real-time” value which considers the impact of batch processes such as clarifier de-sludge and filter backwashing. It’s a good metric for identifying process issues and for driving improvements in plant efficiency.
8 - Cumulative filter turbidity exceedences
Units: %
Both the DWSNZ and the Australian Health Based Targets require reporting of % exceedances of individual filter turbidity over a month. This can be calculated and presented to operations staff in real-time during the month as a cumulative figure.
Both the DWSNZ and the Australian Health Based Targets require reporting of % exceedances of individual filter turbidity over a month. This can be calculated and presented to operations staff in real-time during the month as a cumulative figure.
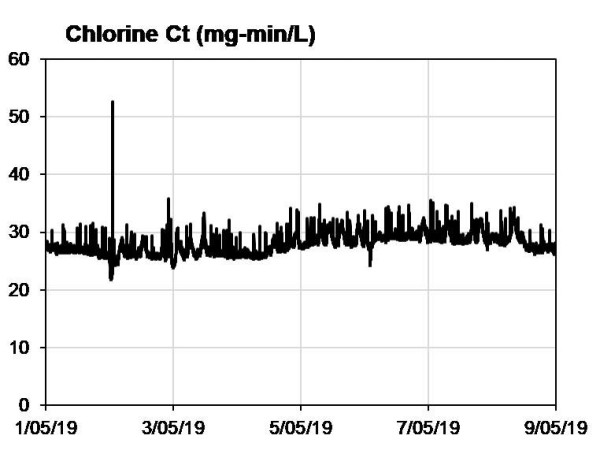
9 - Chlorine C.t value
Units: mg-min/L
This one is now a compliance requirement in NZ so it needs to be calculated on line. You can find more information about it here. The requirements are to calculate the T10 contact time of the chlorine contact tank based on flow, level, known volume and known baffle factor. This then gets multiplied by the free available chlorine equivalent (FACe) measured on the outlet of the chlorine contact tank to provide a real-time Ct value.
This one is now a compliance requirement in NZ so it needs to be calculated on line. You can find more information about it here. The requirements are to calculate the T10 contact time of the chlorine contact tank based on flow, level, known volume and known baffle factor. This then gets multiplied by the free available chlorine equivalent (FACe) measured on the outlet of the chlorine contact tank to provide a real-time Ct value.
10 - Chlorine demand
Units: mg/L/min
Most plants have a chlorine analyser on the inlet and outlet of the chlorine contact tank and yet don’t think to calculate chlorine demand in real-time. Whilst this delta won’t tell you what the total demand is, it gives a good indication of the efficacy of organics removal on the plant or the presence of inorganic chlorine demand. Using the calculated contact time in the chlorine contact time normalises for plant flow rate changes.
So there we have it, 10 analytics that you can apply based on instrumentation that is likely to be already in place at your treatment plant.